Background
The CrossFit Open is the largest participatory fitness competition in the world. Every year, hundreds of thousands of athletes complete the same series of workouts and submit their scores to a global leaderboard. The competition is designed to test broad fitness across multiple domains: strength, endurance, gymnastics, and metabolic conditioning.
A natural question arises: does body type predict who performs best? CrossFit markets itself as a sport that rewards general fitness over specialization, but the physical demands of individual workouts vary dramatically. A heavy barbell workout might favor larger athletes, while a high-rep bodyweight workout might favor lighter ones.
To answer this, I scraped the complete CrossFit Open leaderboard from the competition API, covering every participant from 2011 through 2026. Height and weight data became available starting in 2017, giving us ten years of physical attribute data to work with.
Height and weight have a statistically significant but practically small effect on CrossFit Open placement. The effects are real, consistent across years, and vary by workout, but they explain very little of the variance in performance. Fitness, training, and experience matter far more than body type.
How Body Type Affects Placement
The charts below show Spearman correlations between physical attributes and workout rank. A positive value means larger/heavier/older athletes place worse; a negative value means they place better. Use the filters to explore by year, division, and workout.
Physical Profiles by Performance Tier
How do the physical attributes of top performers compare to the rest of the field? Select a year and division to see the breakdown. The "Overall" view shows aggregate tier data for that year; individual workouts show tier profiles specific to each workout.
Weight Advantage by Workout (All Years)
This table shows the weight-rank correlation for every workout across all years. Blue values indicate heavier athletes performed better; red values indicate lighter athletes performed better. Stronger colors mean larger effects.
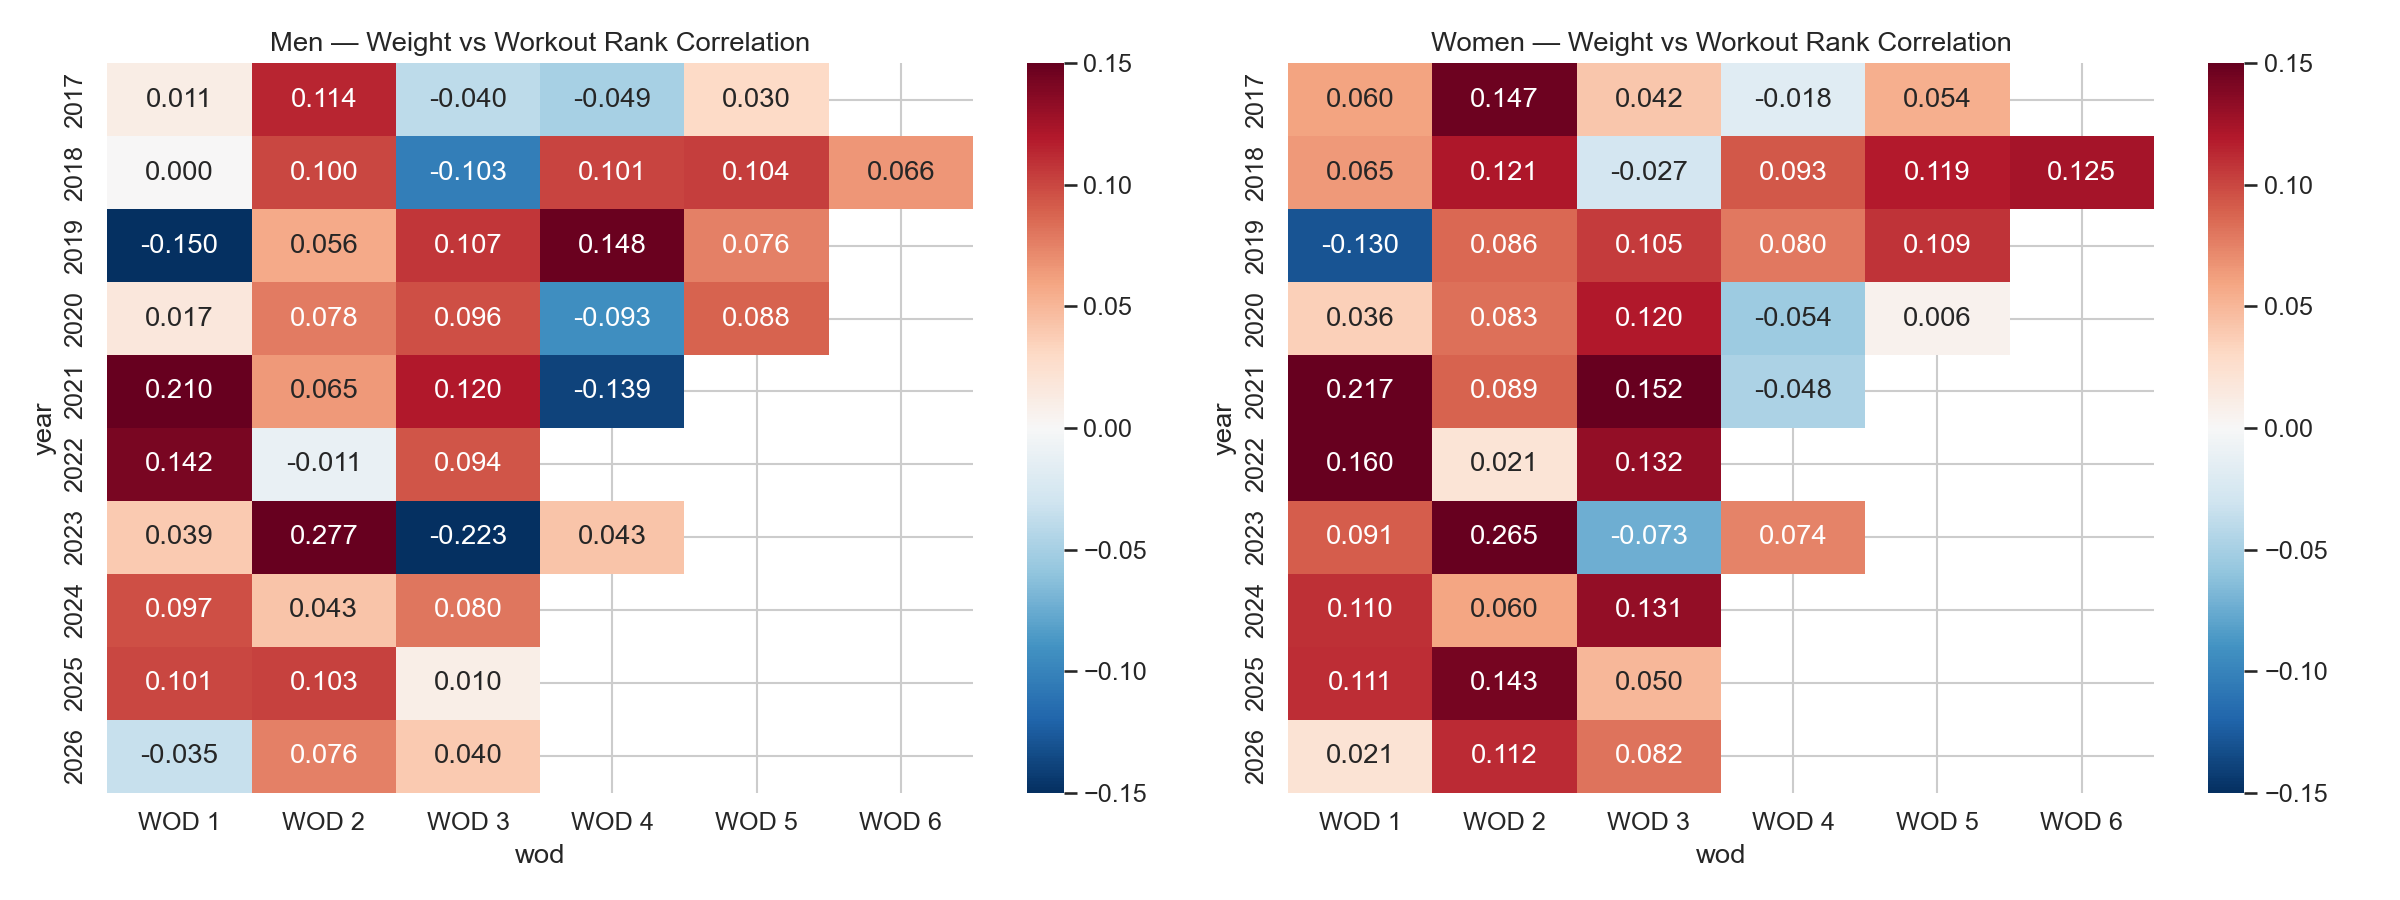
Weight vs workout rank correlation by year. Red cells indicate heavier athletes placed worse; blue cells indicate heavier athletes placed better.
Individual Athlete Performance
Which athletes performed significantly better or worse than expected, based on their history? For each athlete with 3+ years of data, I computed their expected percentile rank from their other years and flagged the largest deviations. A negative residual means the athlete did better than expected; a positive residual means they underperformed.
Methodology
Data was collected by scraping the CrossFit Games leaderboard API
(c3po.crossfit.com) for all Open competition years from 2011 through 2026.
Height and weight data is self-reported by athletes and was available starting in 2017.
Coverage varies by year and division, ranging from about 27% to 87% of athletes having
physical data on file.
All correlations use Spearman's rank correlation coefficient, which is appropriate for non-linear monotonic relationships. Percentile ranks are computed within each year-and-division group. The over/under-performance analysis computes each athlete's "expected" percentile as the mean of their percentile ranks in all other years they competed, then flags the largest residuals. Only athletes with 3+ years of data are included in the outlier analysis for stability.
One important caveat: athletes who report height and weight may differ systematically from those who do not. More serious competitors are more likely to fill out their profiles, which could introduce selection bias.
Key Takeaways
- Age is the biggest physical predictor of placement, not height or weight. Top 1% athletes are about 7-8 years younger than the field average.
- Weight matters more for women than men. Lighter women consistently place better (r = 0.089), while the relationship for men is weaker and non-linear.
- Height is nearly irrelevant overall, explaining less than 0.3% of variance in placement for either gender.
- Individual workouts can strongly favor certain body types. The range of weight-rank correlations across workouts goes from -0.22 to +0.28, meaning workout selection by competition designers has a real impact on which body types are advantaged.
- The "elite" body type has been stable for a decade. Top male performers average 5'9.8", 192 lbs. Top female performers average 5'4.6", 143 lbs. These numbers have barely moved since 2017.